Economic Affairs, Vol. 65, No. 1, pp. 107-115, March 2020
DOI: 10.30954/0424-2513.1.2020.14
©2020 EA. All rights reserved
Price Analysis and Forecasting of Basmati Rice Crop in Karnal District of Haryana
Veer Sain, Raj Kumar* and K.K. Kundu
Department of Agricultural Economics, CCSHAU, Hisar, Haryana, India
*Corresponding author: rajkumarkashyap301@gmail.com (ORCID ID: 0000-0003-3089-6234)
Received: 22-08-2019
Revised: 24-01-2020
Accepted: 21-02-2020
ABSTRACT
The present study was conducted in Assandh and Karnal Blocks of Karnal district, Haryana which was selected purposively on the basis of maximum production under basmati rice crop. Further, four regulated markets in Karnal district, i.e., Karnal, Gharunda, Assandh and Taraori markets were purposively selected for the market study. The results showed that average prices forecast for the year 2017 to be about Rs.1567 per quintal with upper and lower limit Rs 1567 to 1329 per quintal in Karnal market, Rs 1652 per quintal with upper and lower limit Rs 1652 to 1259 per quintal in Gharunda market, Rs 1667 per quintal with upper and lower limit Rs 1667 and 1515 per quintal in Assandh market and Rs 1701 per quintal with upper and lower limit Rs 1701 to 1680 per quintal in Taraori market, respectively.
Highlights
 Trend analysis for average price of basmati rice for the period of 2005 to 2016. Forecasting of basmati rice was made from the historical data using ARIMA models.
Keywords: Forecasting average price, basmati rice, ARIMA, ACF, PACF, Karnal
Market information is critical to the social and economic activities that comprise the development process. Developing economy has witnessed agricultural (green, white, yellow, blue and now rainbow), industrial and information technology revolutions. Good communication system and information system reinforce commitments to sustainable productivity. The Government of India has given more thrust on agriculture, food and information technology sectors towards achievement of economic reforms for achieving high growth rate in production (Dhankar, 2003). Marketing Information System is an interacting structure of people, equipments and procedures to arrange, analyze, evaluate, distribute, timely and right information for use by proper marketing decision makers to improve their marketing design, implementation, and control (Kotler and Keller, 2012). Singh et al. (2011) observed that market information and intelligence were crucial to help farmers in making appropriate marketing decisions, the data on monthly modal prices of basmati for period from January, 2000 to October, 2010 were analyzed by time series method. The estimated ARIMA model used to forecast the likely basmati prices in post-harvesting months and found that these would not increase significantly as compared to those during the harvesting. Based on this along with subjective review of traders' views and government policy, the farmers were advised not to store their produce and sell it immediately on harvesting. About half of the farmers who got this advisory followed it and got benefitted significantly as compared to those who did not make their decision accordingly and stored their produce in anticipation of fetching higher prices. Looking at the usefulness of market intelligence in raising the farm income especially for high value crops, there is need to strengthen the agricultural marketing intelligence component in national agricultural research system along with sanitization of agricultural extension system in this regard. The specific objective of the study was:-
How to cite this article: Sain, V., Kumar, R. and Kundu, K.K. (2020). Price analysis and forecasting of basmati rice crop in Karnal district of Haryana. Economic Affairs, 65(1): 107-115.
1.To estimate the price forecasts and long term relationship in prices among domestic markets.
MATERIALS AND METHODS
The study is based on average prices of basmati rice in Haryana, data for the period of 2005 to 2016 were analyzed the time series methods. Auto Correlation Function (ACF) and Partial Auto Correlation Function (PACF) were calculated for the data. Appropriate Box-Jenkins Auto Regressive Integrated Moving Average (ARIMA) model was fitted. Validity of the model was tested using standard statistical techniques. ARIMA (0, 1, 0) and ARIMA (1, 1, 2) model were used to forecast average prices in Karnal for one leading years. The annual data on average price for the period from 2005 to 2016 were used for forecasting the future values using ARIMA models. The ARIMA methodology is also called as Box Jenkins methodology. The Box-Jenkins procedure is concerned with fitting a mixed Auto Regressive Integrated Moving Average (ARIMA) model to a given set of data. The main objective in fitting this ARIMA model is to identify the stochastic process of the time series and predict the future values accurately. These methods have also been useful in many types of situation which involve the building of models for discrete time series and dynamic systems. But, this method was not good for lead times or for seasonal series with a large random component (Granger and Newbold, 1970). Originally ARIMA models have been studied extensively by George Box and Gwilym Jenkins during 1968 and their names have frequently been used synonymously with general ARIMA process applied to time series analysis, forecasting and control. However, the optimal forecast of future values of a time-series are determined by the stochastic model for that series. A stochastic process is either stationary or non-stationary. The first thing to note is that most time series are non-stationary and the ARIMA model refer only to a stationary time series. Since, the ARIMA models refer only to a stationary time series, the first stage of Box- Jenkins model is reducing non-stationary series to a stationary series by taking first order differences.
The main steps in setting up a Box-Jenkins forecasting model are as follows:
Step 1: Identification
Appropriate value of p,d and q are found first. The tools used for identification are the Autocorrelation Functions (ACF) and Partial Autocorrelation Functions (PACF).
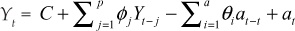
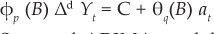
The ARIMA process has the algebraic form:

Where, C is a constant term related to the mean of the process. This is called a mixed auto regressive moving average model of order (p, q). It contains both AR and MA terms.
The general functional forms of ARIMA model used are:
(i)Moving Average model of order q; MA (q)
(ii)Autoregressive model of order p; AR (p)
(iii)Autoregressive Moving Average Model ARMA (p, q)
(iv)Autoregressive Integrated Moving Average Model ARIMA (p, d, q)
(v)Seasonal ARIMA model ARIMA (p, d, q) (P,D,Q)s

Where,
Yt = Variable under forecasting
B = Lag operator
a = Error term (Yt——Yt,, where Yt is the estimated value of Yt)
t = time subscript
ϕp(B) = Non-seasonal AR
ϕ*p(Bs) = seasonal AR operator
(1-B)d = Non-seasonal difference
(1-Bs)d = seasonal difference
θq(B) = Non-seasonal MA
ϕ*p(Bs) = seasonal MA operator
s = order of season (4 in quarterly data, 12 in monthly data etc.)
The above model contains p+q+P+Q parameters, which need to be estimated. The model is non-linear in parameters.
Step 2: Estimation
For estimating the parameters of the ARIMA model, the algorithm is as follows:
For p, d, q, P, D and Q each = 0 to 2
Execute SPSS ARIMA with the set parameters.
Record the parameters and corresponding fitting error until all possible combinations are tried. Select the parameters that produce the least fitting error. This algorithm tries all combinations of parameters, which are limited to an integer lying between zero and two. The combination with the least fitting error will be searched. The range limitations of the parameters are set to restrict the searched to a reasonable scope. Parameters greater than two are rarely used in practices as per literature.
Step 3: Diagnostic checking
Having chosen a particular ARIMA model and having estimated its parameters the fitness of the model is verified. One simple test is to see if the residuals estimated from the model are white noise, if not we must start with other ARIMA model. The residuals were analyzed using Box- Ljung statics.
Step 4: Forecasting
One of the reasons for the popularity of the ARIMA modeling is its success in forecasting. In many cases, the forecasts obtained by this method are more reliable than those obtained from the traditional econometrics modeling, particularly for short-term forecasts. An Autoregressive Integrated Moving Average process model is a way of describing how a time series variable is related to its own past value. Mainly an ARIMA model is used to produce the best weighted average forecasts for single time series (Rahulamin and Razzaque 2000). The accuracy of forecasts for both Ex-ante and Ex-post were using the following test (Markidakis and Hibbon, 1979) such as Mean absolute percentage error (MAPE).
RESULTS AND DISCUSSION
In this study, we used the data average prices for the period 2005 to 2016. As we have earlier stated that development of ARIMA model for any variable involves four steps: Identification, Estimation, Verification and Forecasting. Each of these four steps is now explained for basmati rice average prices as follows.
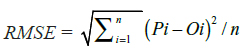
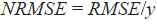
Model Identification
For forecasting Basmati rice average price, ARIMA model estimated only after transforming the variable under forecasting into a stationary series. The stationary series is the one whose values over time only around a constant mean and constant variance. In this difference of order 1 was sufficient to achieve stationarity in mean. The newly constructed variable Xt can now be examined for stationary. The graph of Xt was stationary in mean. The next steps are to identify the values of p, d and q. For this, the auto correlation and partial auto correlation coefficients of various orders of Xt are computed. The model statistics showing goodness fit for Root Mean Square Error (RMSE), Mean Absolute Percentage Error (MAPE), Normalized Bayesian Information Criterion (Normalized BIC), Ljung-Box statistics are depicted in Table 1. The Box-Ljung statistics of ARIMA model for cotton in Karnal, Gharunda, Assandh and Taraori markets of Karnal district are presented in Table 2 and shown significant statistics. The model statistics are given in Table 1. The table shows that the seasonal ARIMA models in orders of (0, 1, 1) (1, 1, 2) were found satisfactory for prices of Basmati rice crop.
Model Estimation and Verification
Basmati rice average prices model parameters were estimated using SPSS package. Results of estimation are reported in Table 2. The model verification is concerned with checking the residual of the model to see if they contain any systematic pattern which still can be removed to improve on the chosen ARIMA. This is done through examing the auto correlations and Partial auto correlations of the residuals of various orders. The ACF and PACF of residual also indicate good fit of the model. The time series plot of the residual showed a scattered trend, therefore, models were fitted properly by residual analysis. The model parameters have been presented in Table 2. The results showing that there was no transformation accounted for the model fitting. It is showing that none of series was found stationary and having volatile trend. In Karnal, Gharunda and Tarori markets, the data set only first order differentiation was found to be fit and seasonal AR(p) of Lag 1 and seasonal MA(q) of Lag 2 were fitted with the degree of differentiation.
Table 1: Model statistics of different markets in Karnal district of Haryana
Table 2: Model parameters of different markets in Karnal district of Haryana
From Assandh market the data set only first order differentiation was found to be fit and seasonal AR(p) of Lag 1 were fitted with on degree of differentiation. The tentative models were identified based on Autocorrelation functions (ACF) and Partial Autocorrelation functions (PACF) at fixed interval, showing significant for price of basmati rice crop in Karnal district markets (Table 3 to 6).
Forecasting with Arima Model
ARIMA models are developed basically to forecast the corresponding variable. To judges the forecasting ability of the fitted ARIMA model important measure of the sample period forecasts accuracy was computed. Forecasting performance of the model was judged by computing Mean Absolute Percent Error (MAPE). The model with less MAPE was preferred for forecasting purposes. Forecasting was done through indentified models for the variable prices of Basmati rice crop in selected district markets. Using the obtained model, the expost forecasted values, considering the January 2005 to December 2016 were computed and have been presented in Fig. 1 to 4. The figs. observed that the forecasted of price in Karnal, Gharunda, Assandh and Taraori markets moved in same direction with observed values.
Table 3: Autocorrelation and partial autocorrelation functions of average monthly prices in Gharunda market of Karnal district
Table 4: Autocorrelation and partial autocorrelation functions of average monthly prices in Gharunda market of Karnal district

Table 5: Autocorrelation and partial autocorrelation functions of average monthly prices in Assandh market of Karnal district
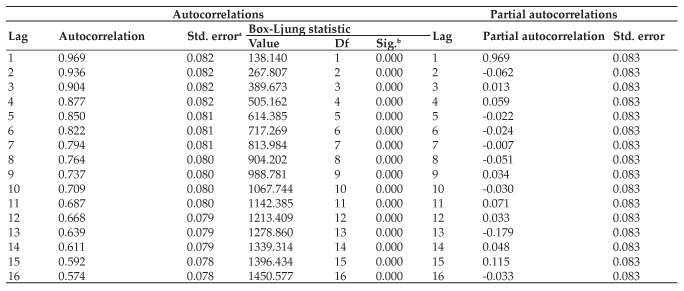
Table 6: Autocorrelation and partial autocorrelation functions of average monthly prices in Taraori market of Karnal district
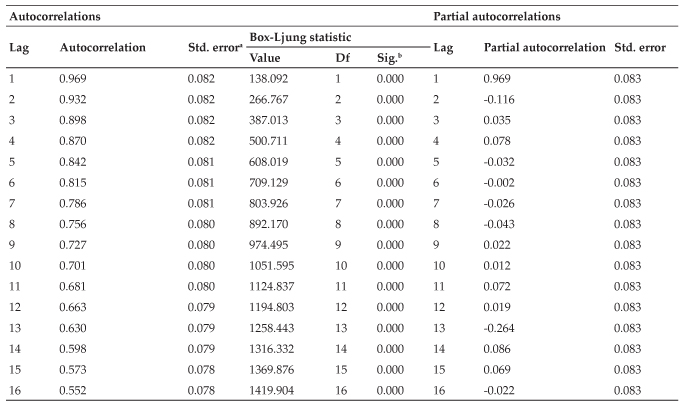
a -The underlying process assumed is independence (white noise);b - Based on the asymptotic chi-square approximation.
Price forecasts for basmati rice
The price forecasts in main market of Karnal district, i.e, Karnal market obtained for the year 2017 for arrival season in September to December were observed between Rs 1567 to 1329, Rs 1652 to 1259 in Gharunda market, Rs 1637 to 1515 in Assandh market and Rs 1701 to 1680 per quintal in Taraori market. While, in the forecasts for the remaining months, i.e,from January to August were in the range Rs 2269 to 1615 in Karnal market, Rs 2215 to 1593 in Gharunda market, Rs 2314 to 1637 in Assandh market and Rs2304 to 1680 per quintal Taraori market. Therefore, it is advisable to the farmers to store their produce and sell in the months where they realize the better/ higher price (Figs. 1 to 4).
Co-integration between selected markets for basmati rice agricultural commodities in Karnal district of Haryana (at zero order integration)
Co-integration is a statistical property obtained by given time series data set that is defined by the concepts of stationarity and the order of integration of the series. The stationary series is one with a mean value which will not change during the sampling period. For an illustration, the mean of a subset of a given series does not vary significantly from the mean of any other subset of the same series. Further, the series will constantly return to its mean value as fluctuations occur. In other words, a non-stationary series will shows a time-varying mean. The order of integration of a series is given by the number of times the series must be differenced in order to produce a stationary series. Co-integration analysis was carried out to study the long run relationship of average price of basmati rice for Karnal districts in all four markets. The Dickey-Fuller test was used to study the order co-integration of prices among different markets.
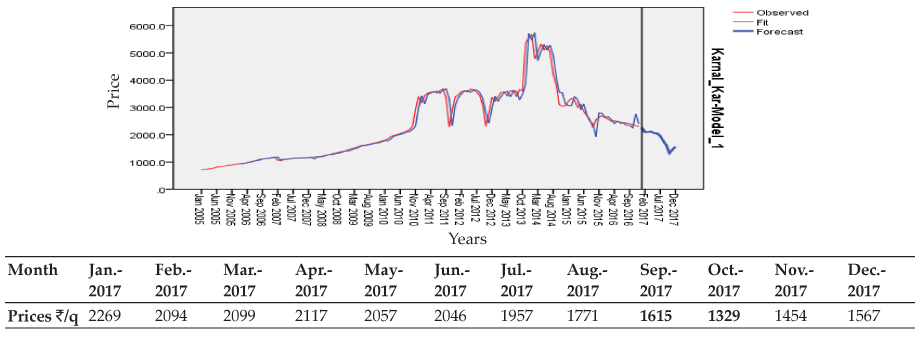
Fig. 1: Forecasting of Basmati rice for average monthly price of Kamal market for Karnal district (Main market)
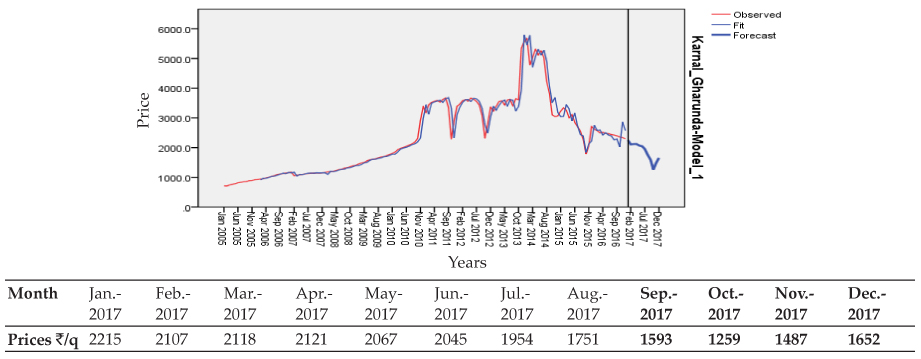
Fig. 2: Forecasting of Basmati rice for average monthly price of Gharunda market for Karnal district (Reference market)
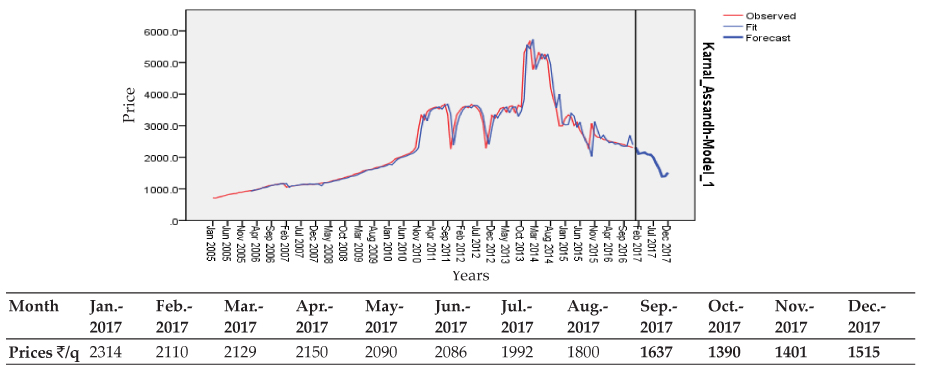
Fig. 3:Forecasting of Basmati rice for average monthly price of Assandh market for Kamal district (Main market)
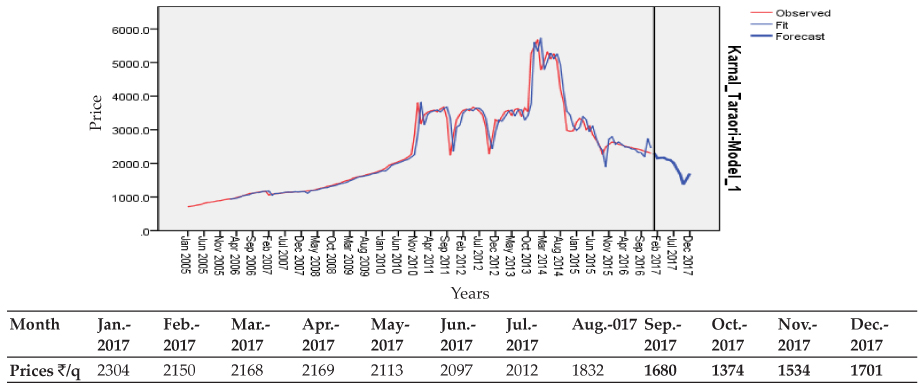
Fig. 4: Forecasting of Basmati rice for average monthly price of Taraori market for Karnal district (Reference market)
Table 7: Co-integration between selected markets for basmati rice selected agricultural commodities in Haryana
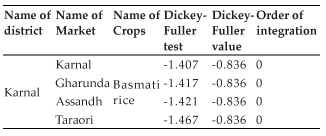
The Table 7 revealed that dickey-fuller test 'tau' was found highly significant for all the Karnal district markets of the basmati rice. That is clearly shown that there is a long relationship and this shows that the price will remain constant over the change of time.
In our study, the developed model for average prices for basmati rice in Karnal district was found to be ARIMA (0, 1, 0) (1, 1, 2) respectively. From the forecast variable by using the developed model, it can be seen that forecasted average price increases the next years. The validity of the forecasted value can be checked when data for the lead periods become available. The model can be used by researchers for forecasting average prices in Karnal. However, it should be updated from time to time with incorporation of current data.
CONCLUSION
In this study the development model for average prices for basmati rice in Karnal district was found to be ARIMA (0,1,0) (1,1,2) respectively. From the forecast variable by using the developed model, it can be seen that forecasted value can be checked when data for the lead periods become available. The model can be used by researchers for forecasting average prices in Karnal. However, it should be updated from time to time with incorporation of current data.
ACKNOWLEDGEMENTS
Authors are thankful to Department of Agricultural Economics, Chaudhary Charan Singh Haryana Agricultural University, Hisar, 123005.
REFERENCES
Box, G.E.P. and Jenkin, G.M. 1976. Time Series of Analysis, Forecasting and Control, Sam Franscico, Holden-Day, California. USA.
Granger, C.W.J. and New Bold, P. 1970. Spectral methods. Econometrica, 30: 424-438.
Kotler, P. and Keller, K. 2009. Marketing Management, 13th edition. Englewood Cliffs NJ, Prentice Hall International.
Makridakis, S. and Hibbon, M. 1979. Accuracy of forecasting: An empirical investigation. Journal of Royal Statistical Society, 41(2): 97-145.
Pindhyck, S.R. and Rubinfeld, D.L. 1991. Econometric Models and Economic Forecasts, New York: McGraw Hill, Inc.
Pride, W. and Ferrell, O. 2003. Marketing: Basic Concepts and Decisions, 12th edition. Boston, Houghton Mifflin Company.
Rahulamin, M.D. and Razzaque, M.A. 2000. Autoregressive Integrated Moving Average Modeling for Monthly Potato Prices in Bangladesh. Journal of Financial Management and Analysis, 13(1): 74-80.
Taey, S. and Alag, M. 2009. Role of market information system technology in the decision making process case study. M. Sc. thesis, University of Business Administration department, Islamic.